MECHANICAL PROPERTIES OF THE HEART I & II
Recommended Reading:
Guyton, A. Textbook of Medical Physiology, 10th Edition. Chapters 9, 14, 20.
Berne & Levy. Principles of Physiology. 4th Edition. Chapter 23.
Learning Objectives:
-
To understand the hemodynamic events occurring during the different phases of the cardiac cycle and to be able to explain these both on the pressure-volume diagram and on curves of pressure and volume versus time.
-
To understand how the end-diastolic pressure volume relationship (EDPVR) and the end-systolic pressure-volume relationship (ESPVR) characterize ventricular diastolic and systolic properties, respectively.
-
To understand the concepts of contractility, preload, afterload, compliance.
-
To understand what Frank-Starling Curves are, and how they are influenced by ventricular afterload and contractility.
-
To understand how afterload resistance can be represented on the PV diagram using the Ea concept and to understand how Ea can be used in concert with the ESPVR to predict how cardiac performance varies with contractility, preload and afterload.
-
To understand the determinants of myocardial oxygen demand and regulation of myocardial blood flow.
Afterload - The mechanical "load" on the ventricle during ejection. Under normal physiological conditions, this is determined by the arterial system. Indices of afterload include, aortic pressure, ejection wall stress, total peripheral resistance (TPR) and arterial impedance.
Compliance - A term used in describing diastolic properties ("stiffness") of the ventricle. Technically, it is defined as the reciprocal of the slope of the EDPVR ([dP/dV]-1). Colloquially, it is frequently used in describing the elevation of the EDPVR.
Contractility - An ill-defined concept, referring the intrinsic "strength" of the ventricle or cardiac muscle. This notion is classically considered to be independent of the phenomenon whereby changes in loading conditions (preload or afterload) result in changes in pressure (or force) generation.
Diastole - (Greek, "dilate"). The phase of the cardiac cycle during which contractile properties return to their resting state.
EDPVR - end-diastolic pressure-volume relationship - The relationship between pressure and volume in the ventricle at the instant of complete relaxation (end-diastole).
Ees - end-systolic Elastance - the slope of the ESPVR; has units of mmHg/ml, and is considered to be an index of "contractility".
EF - ejection fraction - the ratio between SV and EDV. It is the most commonly used index of contractility, mostly because it is relatively easy to measure in the clinical setting. Its major limitation is that it is influenced by afterload conditions.
Elastance - The change in pressure for a given change in volume within a chamber and is an indication of the "stiffness" of the chamber. It has units of mmHg/ml. The higher the elastance the stiffer the wall of the chamber.
ESPVR - end-systolic pressure-volume relationship - The relationship between ventricular pressure and volume at the instant of maximal activation (end-systole) during the cardiac cycle. This relationship is reasonably linear, and reasonably independent of the loading conditions: Pes = Ees [ESV-Vo].
Preload - The "load" imposed on the ventricle at the end of diastole. Measures of preload include end-diastolic volume, end-diastolic pressure and end-diastolic wall stress.
Systole - The first phase of the cardiac cycle which includes the period of time during which the electrical events responsible for initiating contraction and the mechanical events responsible for contraction occur. It ends when the muscles are in the greatest state of activation during the contraction.
SV - stroke volume - the amount of blood expelled during each cardiac cycle. SV = EDV - ESV.
I. INTRODUCTION
The heart is functionally divided into a right side and a left side.
Each side may be further subdivided into a ventricle and an atrium.
The primary role of each atrium is to act as a reservoir and booster
pump for venous return to the heart. With the discovery of atrial naturetic
peptides, other homeostatic roles of the atrium have been proposed.
The primary physiologic function of each ventricle is to maintain circulation
of blood to the organs of the body. The left heart receives oxygenated
blood from the pulmonary circulation and contraction of the muscles
of the left ventricle provide energy to propel that blood through the
systemic arterial network. The right ventricle receives blood from the
systemic venous system and propels it through the lungs and onward to
the left ventricle. The reason that blood flows through the system is
because of the pressure gradients set up by the ventricles between the
various parts of the circulatory system.
In order to understand how the heart performs its task, one must have an appreciation of the force-generating properties of cardiac muscle (excitation-contraction coupling), the factors which regulate the transformation of muscle force into intraventricular pressure, the functioning of the cardiac valves, and something about the load against which the ventricles contract (i.e., the properties of the systemic and pulmonic vascular systems). This syllabus section will focus on a description of the pump function of the ventricles with particular attention to a description of those properties as represented on the pressure-volume diagram. Emphasis will be given to the clinically relevant concepts of contractility, afterload and preload. In addition, we will review how the ventricle and the arterial system interact to determine cardiovascular performance (cardiac output and blood pressure). Exercises have been created for a web-based cardiovascular simulator in order to help you learn about these fundamental properties as well as the complex and dynamic physiology. http://www.columbia.edu……
II. EXCITATION-CONTRACTION COUPLING.
The sequence of events that lead to myocardial contraction is triggered
by electrical depolarization of the cell; electrical depolarization
increases the probability of sarcolemmal calcium channel opening, which
in turn results in calcium influx into the cell. A rise in calcium concentration
then occurs in the subsarcolemmal space near the lateral cisternae of
the sarcoplasmic reticulum. This rise in local calcium concentration
causes the release of a larger pool of calcium stored in the sarcoplasmic
reticulum through calcium release channels called ryanodine receptors,
which are found in high concentration near the lateral cisternae.
The mechanisms by which the subsarcolemmal rise in calcium concentration
results in calcium release from the sarcoplasmic reticulum, a process
referred to as calcium-induced calcium release, are not fully elucidated;
a tight anatomic coupling between the sarcolemmal calcium channels and
ryanodine receptors has suggested that conformational changes of calcium
channel proteins can directly influence the properties of the ryanodine
receptor. The calcium released from the sarcoplasmic reticulum diffuses
through the myofilament lattice and is available for binding to troponin,
which disinhibits actin and myosin interactions and results in force
production.
Calcium release is rapid and does not require energy because of the large calcium concentration gradient between the sarcoplasmic reticulum and the cytosol during diastole. In contrast, removal of calcium from the cytosol and from troponin occurs up a concentration gradient and is an energy-requiring process. Calcium sequestration is primarily accomplished by pumps on the sarcoplasmic reticulum membrane that consume ATP (sarcoplasmic reticulum Ca2+-ATPase pumps); these pumps are located in the central portions of the sarcoplasmic reticulum and are in close proximity to the myofilaments. Sarcoplasmic reticulum Ca2+-ATPase activity is regulated by the phosphorylation status of another sarcoplasmic reticulum protein, phospholamban. To maintain calcium homeostasis, an amount of calcium equal to what entered the cell through the sarcolemmal calcium channels must also exit with each beat. This equilibrium is accomplished primarily by the sarcolemmal sodium-calcium exchanger, a transmembrane protein that translocates calcium across the membrane down its concentration gradient in exchange for sodium ions moved in the opposite direction. Sodium homeostasis is in turn regulated largely by the ATP-requiring sodium-potassium pump on the sarcolemma.
As suggested above, the amount of calcium release and the rate of calcium
uptake are under regulation of the ![]() -adrenergic
pathway which provides a ready means of enhancing contractile force
under settings of stress.
-adrenergic
pathway which provides a ready means of enhancing contractile force
under settings of stress.  -agonist (e.g.,
epinephrine or norepinephrine) binding to the
 ![]() -receptor
activates membrane bound adenylyl cyclase which results in the generation
of cAMP and thence to phosphokinase A (PKA) activation. PKA activation
results in phosphorylation of phospholamban, the calcium channel, the
ryanodine receptor and sarcomeric regulatory proteins. The modification
of protein function caused by such phosphorylations results in a coordinated
increase in calcium entry, uptake and release with associated increase
in contractile strength.
-receptor
activates membrane bound adenylyl cyclase which results in the generation
of cAMP and thence to phosphokinase A (PKA) activation. PKA activation
results in phosphorylation of phospholamban, the calcium channel, the
ryanodine receptor and sarcomeric regulatory proteins. The modification
of protein function caused by such phosphorylations results in a coordinated
increase in calcium entry, uptake and release with associated increase
in contractile strength.
III. FORCE-LENGTH RELATIONS.
In addition to calcium, cardiac muscle length exerts a major influence
on force production. Because each muscle is composed of a linear array
of sarcomere bundles from one end of the muscle to the other, muscle
length is directly proportional to the average sarcomere length. Changes
in sarcomere length alter the geometric relationship between thick and
thin filaments. For myofilaments in general, optimal force is achieved
when sarcomere length is about 2.2 to 2.3 ![]() m,
the length that provides optimal overlap of thick and thin filaments.
As sarcomere length is decreased below about 2.0
m,
the length that provides optimal overlap of thick and thin filaments.
As sarcomere length is decreased below about 2.0 ![]() m,
the tips of apposing thin filaments hit each other, the thick filaments
approach the Z lines, and the lateral distance between thick and thin
filaments increases. Each of these factors contributes to a reduction
in force with decreasing sarcomere length. In skeletal muscle, when
sarcomeres are stretched beyond 2.3
m,
the tips of apposing thin filaments hit each other, the thick filaments
approach the Z lines, and the lateral distance between thick and thin
filaments increases. Each of these factors contributes to a reduction
in force with decreasing sarcomere length. In skeletal muscle, when
sarcomeres are stretched beyond 2.3 ![]() m,
force decreases because fewer myosin heads can reach and bind with actin;
skeletal muscle can typically operate in this so-called descending limb
of the sarcomere force-length relationship. In cardiac muscle, however,
constraints imposed by the sarcolemma prevent myocardial sarcomeres
from being stretched beyond 2.3
m,
force decreases because fewer myosin heads can reach and bind with actin;
skeletal muscle can typically operate in this so-called descending limb
of the sarcomere force-length relationship. In cardiac muscle, however,
constraints imposed by the sarcolemma prevent myocardial sarcomeres
from being stretched beyond 2.3 ![]() m,
even under conditions of severe heart failure when very high stretching
pressures are imposed on the heart.
m,
even under conditions of severe heart failure when very high stretching
pressures are imposed on the heart.
Force-length relationships are conveniently used to characterize systolic and diastolic contractile properties of cardiac muscle. These relationships are measured by holding the ends of an isolated muscle strip and measuring the force developed at different muscle lengths while preventing the muscle from shortening (isometric contractions). As the muscle is stretched from its slack length (the length at which no force is generated), both the resting (end-diastolic) tension and the peak (end-systolic) tension increase. The end-diastolic force-length relationship is non-linear and exhibits a shallow slope at small lengths and a steeper slope at larger lengths, which is a reflection of the non-linear mechanical restraints imposed by the sarcolemma and extracellular matrix to prevent overstretch of the sarcomeres. End-systolic force increases with increasing muscle length to a much greater degree than does end-diastolic force. The difference in force at end-diastole as compared with end-systole increases as muscle length increases and indicates a greater amount of developed force as the muscle is stretched. This fundamental property of cardiac muscle is called the Frank-Starling law of the heart in recognition of its two discoverers. If a drug increases the amount of calcium released to the myofilaments (for example, epinephrine, which belongs to a class of drugs referred to as inotropic agents), the end-systolic force-length relationship will be shifted upward and at any given length the muscle can generate more force. Inotropic agents typically do not affect the end-diastolic force-length relationship. In view of the prominent effect of muscle length on force generation, the intrinsic strength of cardiac muscle, commonly referred to as muscle contractility, should be indexed by the end-systolic force-length relationship and not simply by peak force generation.
IV. MYOCARDIAL OXYGEN CONSUPTION.
The heart relies almost exclusively on oxidation of fatty acids and
glucose as an immediate source of energy. The heart normally extracts
free fatty acids preferentially from the coronary perfusion for oxidative
energy production. Under conditions of limited oxygen supply, this preference
is changed to glucose. Greater energy is consumed in metabolizing free
fatty acids than in metabolizing glucose. Under most conditions, anaerobic
metabolism provides very limited energy. Severe hypoxia with high coronary
flow produces lactate and anaerobic ATP. The much more common condition
of ischemia with acidosis results in little anaerobic energy. Under
most steady-state circumstances, the heart is dependent on the availability
of oxygen to continue its function.
The oxygen and energy consumption of the heart is determined principally by its contractile activity. Three major independent hemodynamic or mechanical factors contribute to myocardial oxygen consumption by the heart: heart rate, the tension developed by the heart during systole, and the contractile state (contractility) of the heart. If the heart rate rises from 60 to 180 beats per minute during exercise or stress, oxygen consumption will increase approximately three-fold over the basal value. Only 10% or less of the total oxygen consumption of the heart is used to maintain functions other than contraction; if the heart ceases to beat but is kept alive, it will consume approximately 10% of the normal amount of oxygen. With an increase in the contractile state, an additional obligatory increase in oxygen consumption is produced due to the increased sarcoplasmic reticular ATPase activity required to sequester the increased amount of cycling calcium that underlies the increase in contractility.
The volume of coronary or myocardial blood flow under normal conditions is largely regulated by myocardial oxygen demands. Because the heart extracts 75% or more of the oxygen present in the coronary blood, the striking increases in oxygen consumption that occur with high tension development, higher heart rates, and/or high contractility are met almost entirely by increases in coronary blood flow.
The most important regulators of coronary vascular tone are adenosine and nitric oxide. Adenosine is the byproduct of the breakdown of ATP to adenosine monophosphate and then to adenosine. Nitric oxide is produced by coronary vascular endothelial cells and has a direct local vasodilating effect on coronary arteries and the more distal bed. In addition to adenosine and nitric oxide, other longer-acting coronary vasodilators such as bradykinin, prostaglandins, and CO2 may have a direct effect in maintaining coronary artery blood flow.
Given that the coronary vessels are surround a pressurized chamber, it should not be surprising that mechanical factors also influence coronary blood flow. The head of pressure at the origin of the coronary artery and the pressure within the large epicardial coronary arteries directly reflect the central aortic pressure. During diastole, the resistance to blood flow from the coronary arteries is largely from the tone of resistance vessels. However, during systole, left ventricular intracavitary pressure will compress conornary vessels; due to their proximaity, endocardial coronary arteries are remarkably compressed, while epicaridal vessels are much less compressed. Therefore, under normal conditions, coronary blood flow occurs both during systole and diastole in epicardial vessels, but is essentially exclusively limited to diastole in the subendocardium. Under some pathologic conditions However, if left ventricular diastolic pressure significantly increases for whatever reason, subendocardial blood flow may be reduced during this critical period of diastole. Additionally, tachycardia can profoundly reduce subendocardial blood flow given that the time period of diastole decreases with increased heart rate. In fact, administration of drugs to slow the heart rate is one of the main treatment strategies in the setting of coronary artery disease and myocardial ischemia (while a reduction in heart rate reduces myocardial oxygen demand, it also very importantly increases the diastolic time period for oxygen delivery).
V. THE CARDIAC CYCLE AND PRESSURE-VOLUME LOOPS
The cardiac cycle (the period of time required for one heart beat) is
divided into two major phases: systole and diastole. Systole (from Greek,
meaning "contracting") is the period of time during which
the muscle transforms from its totally relaxed state (with crossbridges
uncoupled) to the instant of maximal mechanical activation (point of
maximal crossbridge coupling). The onset of systole occurs when the
cell membrane depolarizes and calcium enters the cell to initiate a
sequence of events which results in cross-bridge interactions (excitation-contraction
coupling). Diastole (from Greek, meaning "dilation") is the
period of time during which the muscle relaxes from the end-systolic
(maximally activated) state back towards its resting state. Systole
is considered to start at the onset of electrical activation of the
myocardium (onset of the ECG); systole ends and diastole begins as the
activation process of the myofilaments passes through a maximum. In
the discussion to follow, we will review the hemodynamic events occurring
during the cardiac cycle in the left ventricle. The events in the right
ventricle are similar, though occurring at slightly different times
and at different levels of pressure than in the left ventricle.
The mechanical events occurring during the cardiac cycle consist of changes in pressure in the ventricular chamber which cause blood to move in and out of the ventricle. Thus, we can characterize the cardiac cycle by tracking changes in pressures and volumes in the ventricle as shown in the Figure 1 where ventricular volume (LVV), ventricular pressure (LVP), left atrial pressure (LAP) and aortic pressure (AoP) are plotted as a function of time.
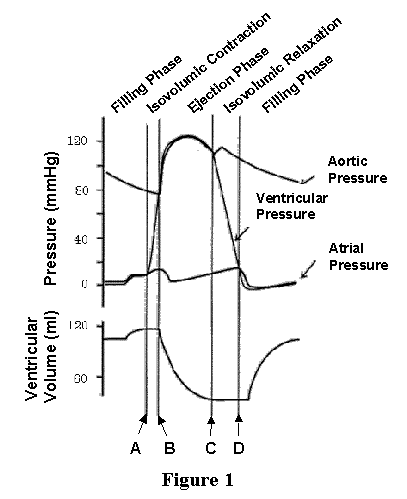
Shortly prior to time "A" LVP and LVV are relatively constant and AoP is gradually declining. During this time the heart is in its relaxed (diastolic) state; AoP falls as the blood ejected into the arterial system on the previous beat gradually moves from the large arteries to the capillary bed. At time A there is electrical activation of the heart, contraction begins, and pressure rises inside the chamber. Early after contraction begins, LVP rises to be greater than left atrial pressure and the mitral valve closes. Since LVP is less than AoP, the aortic valve is closed as well. Since both valves are closed, no blood can enter or leave the ventricle during this time, and therefore the ventricle is contracting isovolumically (i.e., at a constant volume). This period is called isovolumic contraction. Eventually (at time B), LVP slightly exceeds AoP and the aortic valve opens. During the time when the aortic valve is open there is very little difference between LVP and AoP, provided that AoP is measured just on the distal side of the aortic valve. During this time, blood is ejected from the ventricle into the aorta and LV volume decreases. The exact shapes of the aortic pressure and LV volume waves during this ejection phase are determined by the complex interaction between the ongoing contraction process of the cardiac muscles and the properties of the arterial system and is beyond the scope of this lecture. As the contraction process of the cardiac muscle reaches its maximal effort, ejection slows down and ultimately, as the muscles begin to relax, LVP falls below AoP (time C) and the aortic valve closes. At this point ejection has ended and the ventricle is at its lowest volume. The relaxation process continues as indicated by the continued decline of LVP, but LVV is constant at its low level. This is because, once again, both mitral and aortic valves are closed; this phase is called isovolumic relaxation. Eventually, LVP falls below the pressure existing in the left atrium and the mitral valve opens (at time D). At this point, blood flows from the left atrium into the LV as indicated by the rise of LVV; also note the slight rise in LVP as filling proceeds. This phase is called filling. In general terms, systole includes isovolumic contraction and ejection; diastole includes isovolumic relaxation and filling.
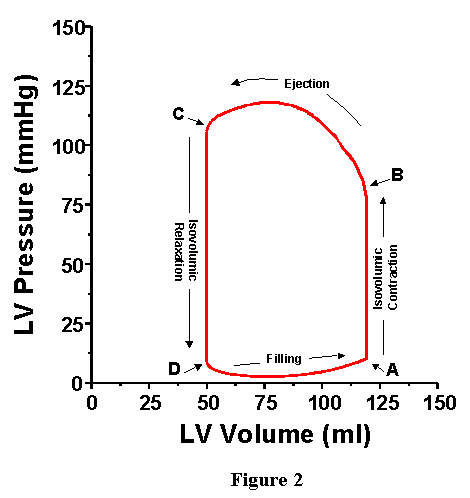
Whereas the four phases of the cardiac cycle are clearly illustrated on the plots of LVV, LVP, LAP and AoP as a function of time, it turns out that there are many advantages to displaying LVP as a function of LVV on a "pressure-volume diagram" (these advantages will be made clear by the end of this syallbus entry). This is accomplished simply by plotting the simultaneously measured LVV and LVP on appropriately scaled axes; the resulting pressure-volume diagram corresponding to the curves of Figure 1 is shown in Figure 2, with volume on the x-axis and pressure on the y-axis. As shown, the plot of pressure versus volume for one cardiac cycle forms a loop. This loop is called the pressure-volume loop (abbreviated PV loop). As time proceeds, the PV points go around the loop in a counter clockwise direction. The point of maximal volume and minimal pressure (i.e., the bottom right corner of the loop) corresponds to time A on Fig. 1, the onset of systole. During the first part of the cycle, pressure rises but volume stays the same (isovolumic contraction). Ultimately LVP rises above AoP, the aortic valve opens (B), ejection begins and volume starts to go down. With this representation, AoP is not explicitly plotted; however as will be reviewed below, several features of AoP are readily obtained from the PV loop. After the ventricle reaches its maximum activated state (C, upper left corner of PV loop), LVP falls below AoP, the aortic valve closes and isovolumic relaxation commences. Finally, filling begins with mitral valve opening (D, bottom left corner).
VI. PHYSIOLOGIC MEASUREMENTS RETRIEVABLE FROM THE
PRESSURE-VOLUME LOOP.
As reviewed above, the ventricular pressure-volume loop displays the
instantaneous relationship between intraventricular pressure and volume
throughout the cardiac cycle. It turns out that with this representation
it is easy to ascertain values of several parameters and variables of
physiologic importance.
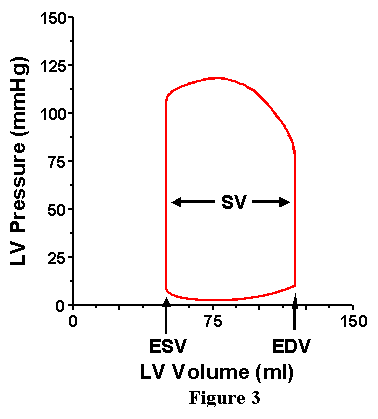
Consider first the volume axis (Figure 3). It is appreciated that we can readily pick out the maximum volume of the cardiac cycle. This volume is called the end-diastolic volume (EDV) because this is the ventricular volume at the end of a cardiac cycle. Also, the minimum volume the heart attains is also retrieved; this volume is known as the end-systolic volume (ESV) and is the ventricular volume at the end of the ejection phase. The difference between EDV and ESV represents the amount of blood ejected during the cardiac cycle and is called the stroke volume (SV).
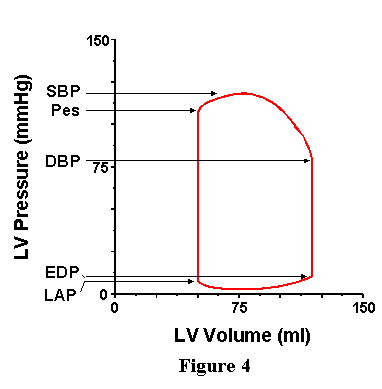
Now consider the pressure axis (Figure 4). Near the top of the loop we can identify the point at which the ventricle begins to eject (that is, the point at which volume starts to decrease) is the point at which ventricular pressure just exceeds aortic pressure; this pressure therefore reflects the pressure existing in the aorta at the onset of ejection and is called the diastolic blood pressure (DBP). During the ejection phase, aortic and ventricular pressures are essentially equal; therefore, the point of greatest pressure on the loop also represents the greatest pressure in the aorta, and this is called the systolic blood pressure (SBP). One additional pressure, the end-systolic pressure (Pes) is identified as the pressure of the left upper corner of the loop; the significance of this pressure will be discussed in detail below. Moving to the bottom of the loop, we can reason that the pressure of the left lower corner (the point at which the mitral valve opens and ejection begins) is roughly equal to the pressure existing in the left atrium (LAP) at that instant in time (recall that atrial pressure is not a constant, but varies with atrial contraction and instantaneous atrial volume). The pressure of the point at the bottom right corner of the loop is the pressure in the ventricle at the end of the cardiac cycle and is called the end-diastolic pressure (EDP).
VII. PRESSURE-VOLUME RELATIONSHIPS
It is readily appreciated that with each cardiac cycle, the muscles
in the ventricular wall contract and relax causing the chamber to stiffen
(reaching a maximal stiffness at the end of systole) and then to become
less stiff during the relaxation phase (reaching its minimal stiffness
at end-diastole). Thus, the mechanical properties of the ventricle are
time-varying, they vary in a cyclic manner, and the period of the cardiac
cycle is the interval between beats. In the following discussion we
will explore one way to represent the time-varying mechanical properties
of the heart using the pressure-volume diagram. We will start with a
consideration of ventricular properties at the extreme states of stiffness
-- end systole and end diastole -- and then explore the mechanical properties
throughout the cardiac cycle.
End-diastolic pressure-volume relationship (EDPVR).
Let us first examine the properties of the ventricle at end-diastole.
Imagine the ventricle frozen in time in a state of complete relaxation.
We can think of the properties of this ventricle with weak, relaxed
muscles, as being similar to those of a floppy balloon. What would happen
to pressure inside a floppy balloon if we were to vary its volume. Let's
start with no volume inside the balloon; naturally there would be no
pressure. As we start blowing air into the balloon there is initially
little resistance to our efforts as the balloon wall expands to a certain
point. Up to that point, the volume increases but pressure does not
change. We will refer to this volume as Vo, or the maximal volume at
which pressure is still zero mmHg; this volume is also frequently referred
to as the unstressed volume. As the volume increases we meet with increasing
resistance to or efforts to expand the balloon, indicating that the
pressure inside the balloon is becoming higher and higher. The ventricle,
frozen in its diastolic state, is much like this balloon. A typical
relationship between pressure and volume in the ventricle at end-diastole
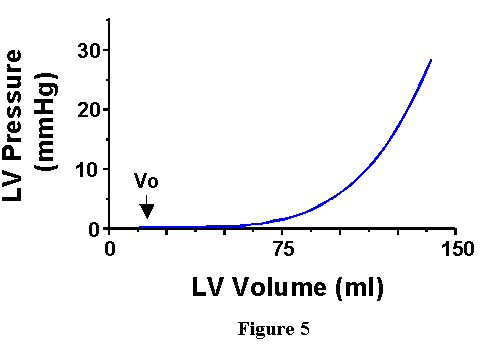
is shown in Figure 5. As volume is increased initially, there is little
increase in pressure until a certain point, designated "Vo".
After this point, pressure increases with further increases in volume.
This curve is called the "end-diastolic pressure-volume relationship"
(EDPVR).
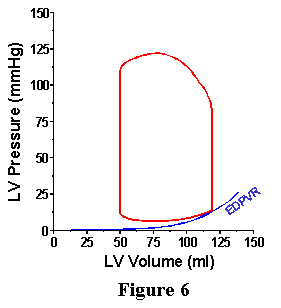
Under normal conditions, the heart would never exist in such a frozen state as proposed above. However, during each contraction there is a period of time during which the mechanical properties of the heart are characterized by the EDPVR; knowledge of the EDPVR allows one to specify, for the end of diastole, EDP if EDV is known, or visa versa. Furthermore, since the EDPVR provides the pressure-volume relation with the heart in its most relaxed state, the EDPVR provides a boundary on which the PV loop falls at the end of the cardiac cycle as shown in Figure 6.
Under certain circumstances, the EDPVR may change. Physiologically, the EDPVR changes as the heart grows during childhood. Most other changes in the EDPVR accompany pathologic situations. Examples include the changes which occur with hypertrophy, the healing of an infarct, and the evolution of a dilated cardiomyopathy, to name a few.
Compliance is a term which is frequently used in discussions of the end-diastolic ventricular. Technically, compliance is the change in volume for a given change in pressure or, expressed in mathematical terms, it is the reciprocal of the derivative of the EDPVR ( [dP/dV]-1 ). Since the EDPVR is nonlinear, the compliance varies with volume; compliance is greatest at low volume and smallest at high volumes (Figure 7). In the clinical arena, however, compliance is used in two different ways. First, it is used to express the idea that the diastolic properties are, in a general way, altered compared to normal; that is, that the EDPVR is either elevated or depressed compared to normal. Second, it is used to express the idea that the heart is working at a point on the EDPVR where its slope is either high or low (this usage is technically more correct). Undoubtedly you will hear this word used in the clinical setting, usually in a casual manner: "The patients heart is noncompliant". Such a statement relays no specific information about what is going on with the diastolic properties of the heart. Statements specifying changes in the EDPVR or changes in the working volume range relay much more information. Understanding of these concepts has been highlighted recently with growing appreciation for the fact that some patients can experience heart failure when the EDPVR becomes elevated (as in hypertrophy) despite that fact that the strength of the heart during contraction is normal. This clinical phenomenon has been referred to as diastolic dysfunction.
End-systolic pressure-volume relationship (ESPVR)
Let us move now to the opposite extreme in the cardiac cycle: end-systole.
At that instant of the cardiac cycle, the muscles are in their maximally
activated state and it is easy to imagine the heart as a much stiffer
chamber. As for end diastole, we can construct a pressure-volume relationship
at end systole if we imagine the heart frozen in this state of maximal
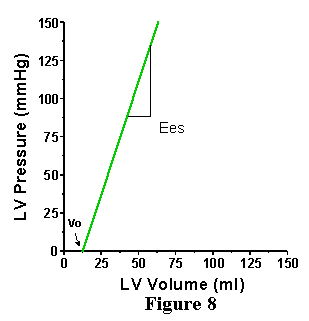
activation. An example is shown in Figure 8. As for the EDPVR, the end-systolic
pressure volume relationship (ESPVR) intersects the volume axis at a
slightly positive value (Vo), indicating that a finite amount of volume
must fill the ventricle before it can generate any pressure. For our
purposes, we can assume that the Vo of the ESPVR and the Vo of the EDPVR
are the same (this is not exactly true, but little error is made in
assuming this and it simplifies further discussions). In contrast to
the nonlinear EDPVR, the ESPVR has been shown to be reasonably linear
over a wide range of conditions, and can therefore be expressed by a
simple equation:
Pes = Ees (V-Vo)
where Pes is the end-systolic pressure, Vo is as defined above, V is the volume of interest and Ees is the slope of the linear relation. There is no a priori reason to expect that this relationship should be linear, it is simply an experimental observation. Ees stands for end systolic elastance. Elastance means essentially the same thing as stiffness and is defined as the change in pressure for a given change in volume within a chamber; the higher the elastance, the stiffer the wall of the chamber.
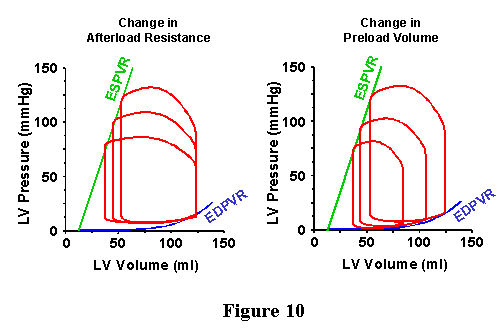
| As discussed above for the EDPVR, the heart would never exist in a frozen state of maximal activation. However, it does pass through this state during each cardiac cycle. The ESPVR provides a line which the PV loop will hit at end-systole, thus providing a second boundary for the upper left hand corner of the PV loop (Figure 9). Examples of different PV loops bounded by the ESPVR and EDPVR are shown in Figure 10. In the panel on the left, there are three PV loops, which have the same EDV but have different aortic pressures; in obtaining these loops the properties of the arterial system were changed (specifically, the total peripheral resistance was modified) without modifying anything about the way the ventricle works. The upper left hand corner of each loop falls on the ESPVR, while the bottom right part of the loop falls on the EDPVR. In the panel on the right, three different loops are shown which have different EDVs and different aortic pressures. Here, the loops were obtained by modifying only the EDV without modifying anything about the heart or the arterial system. The upper left hand corner of each loop falls on the ESPVR, while the bottom right part of the loop falls on the EDPVR. | 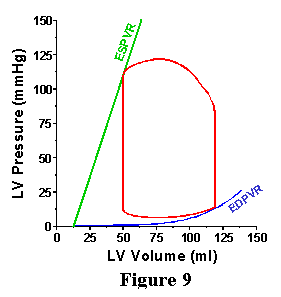 |
Time varying elastance: E(t)
In the above discussion we have described the pressure-volume relationships
at two instances in the cardiac cycle: end diastole and end systole.
The idea of considering the pressure-volume relation with the heart
frozen in a given state can be generalized to any point during the cardiac
cycle. That is, at each instant of time during the cardiac cycle there
exists a pressure-volume relationship. Such relations have been determined
in the physiology laboratory. These experiments show, basically, that
there is a relatively smooth transition from the EDPVR to the ESPVR
and back. For most parts of the cardiac cycle these relations can be
considered 1) to be linear and 2) to intersect at a common point, namely
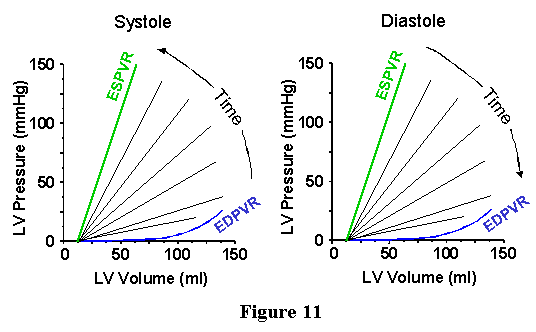
Vo. This idea is schematized in Figure 11. In the left panel the transition
from the EDPVR towards the ESPVR during the contraction phase is illustrated,
and the relaxation phase is depicted in the right panel. Since the instantaneous
pressure-volume relations (PVR) are reasonably linear and intersect
at a common point, it is possible to characterize the time course of
change in ventricular mechanical properties by plotting the time course
of change in the slope of the instantaneous PVR. Above, we referred
to the slope of the ESPVR as an elastance. Similarly, we can refer to
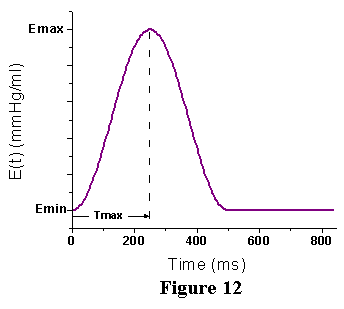
the slopes of the instantaneous PVRs as elastances. A rough approximation
of the instantaneous elastance throughout a cardiac cycle is shown in
Figure 12. Note that the maximal value, Ees, is the slope of the ESPVR.
The minimum slope, Emin, is the slope of the EDPVR in the low volume
range. We refer to the function depicted in Fig. 11 as the time varying
elastance and it is referred to as E(t). With this function it is possible
to relate the instantaneous pressure (P) and volume (V) throughout the
cardiac cycle: P(V,t) = E(t) [V(t) - Vo], where Vo and E(t) are as defined
above and V(t) is the time varying volume. This relationship breaks
down near end-diastole and early systole when there are significant
nonlinearities in the pressure-volume relations at higher volumes. More
detailed mathematical representations, beyond the scope of these lectures,
are now available to describe the time-varying contractile properties
of the ventricle which account for the nonlinear EDPVR. Nevertheless,
the implication of this equation is that if one knows the E(t) function
and if one knows the time course of volume changes during the cycle,
one can predict the time course of pressure changes throughout the cycle.
VIII. CONTRACTILITY
Contractility is an ill-defined concept used when referring to the intrinsic
strength of the ventricle or cardiac muscle. By intrinsic strength we
mean those features of the cardiac contraction process that are intrinsic
to the ventricle (and cardiac muscle) and are independent of external
conditions imposed by either the preload or afterload (i.e., the venous,
atrial or arterial) systems. For example consider, once again, the PV
loops in Fig. 10. We see that in the panel on the left that the actual
amount of pressure generated by the ventricle and the stroke volume
are different in the three cases, although we stated that these loops
were obtained by modifying the arterial system an not changing anything
about the ventricle. Thus, the changes in pressure generation in that
figure do not represent changes in contractility. Similarly, the changes
in pressure generation and stroke volume shown in the panel on the right
side of the figure were brought about simply by changing the EDV of
the ventricle and do not represent changes in ventricular contractility.
Now that we have demonstrated changes in ventricular performance (i.e., pressure generation and SV), which do not represent changes in contractility, let's explore some changes that do result from changes in contractility. First, how can contractility be changed? Basically, we consider ventricular contractility to be altered when any one or combination of the following events occurs:
-
the amount of calcium released to the myofilaments is changed
-
the affinity of the myofilaments for calcium is changed
-
there is an alteration in the number of myofilaments available to participate in the contraction process.
You will recall that calcium interacts with troponin to trigger a sequence of events that allows actin and myosin to interact and generate force. The more calcium available for this process, the greater the number of actin-myosin interactions. Similarly, the greater troponin's affinity for calcium the greater the amount of calcium bound and the greater the number of actin-myosin interactions. Here we are linking contractility to cellular mechanisms that underlie excitation-contraction coupling and thus, changes in ventricular contractility would be the global expression of changes in contractility of the cells that make up the heart. Stated another way, ventricular contractility reflects myocardial contractility (the contractility of individual cardiac cells).
Through the third mechanism, changes in the number of muscle cells, as apposed to the functioning of any given muscle cell, cause changes in the performance of the ventricle as an organ. In acknowledging this as a mechanism through which ventricular contractility can be modified we recognize that ventricular contractility and myocardial contractility are not always linked to each other.
Humoral and pharmacologic agents can modify ventricular contractility
by the first two mechanisms. ![]() -adrenergic
agonists (e.g. norepinephrine) increase the amount of calcium released
to the myofilaments and cause an increase in contractility. In contrast,
-adrenergic
agonists (e.g. norepinephrine) increase the amount of calcium released
to the myofilaments and cause an increase in contractility. In contrast,
![]() -adrenergic antagonists
(e.g., propranolol) blocks the effects of circulating epinephrine and
norepinephrine and reduce contractility. Nifedipine is a drug that blocks
entry of calcium into the cell and therefore reduces contractility when
given at high doses. One example of how ventricular contractility can
be modified by the third mechanism mentioned above is the reduction
in ventricular contractility following a myocardial infarction where
there is loss of myocardial tissue, but the unaffected regions of the
ventricle function normally.
-adrenergic antagonists
(e.g., propranolol) blocks the effects of circulating epinephrine and
norepinephrine and reduce contractility. Nifedipine is a drug that blocks
entry of calcium into the cell and therefore reduces contractility when
given at high doses. One example of how ventricular contractility can
be modified by the third mechanism mentioned above is the reduction
in ventricular contractility following a myocardial infarction where
there is loss of myocardial tissue, but the unaffected regions of the
ventricle function normally.
| While it is true that when contractility is changed there are generally changes in ventricular pressure generation and stroke volume, we have seen above that both of these can occur as a result of changes in EDV or arterial properties alone. Thus, measures like stroke volume and pressure would not be reliable indices of contractility. It turns out that we can look towards changes in the ESPVR to indicate changes in contractility, as shown in Figure 13. When agents known to increase ventricular contractility are administered to the heart there is an increase in Ees, the slope of the ESPVR. Such agents are known as positive "inotropic" agents. (Inotropic: from Greek meaning influencing the contractility of muscular tissue). Conversely, agents that are negatively inotropic reduce Ees. It is significant that neither Vo (the volume-axis intercept of the ESPVR) nor the EDPVR are affected significantly by these acute changes in contractility. Thus, because Ees varies with ventricular contractility but is not affected by changes in the arterial system properties nor changes in EDV, Ees is considered to be an index of contractility. | 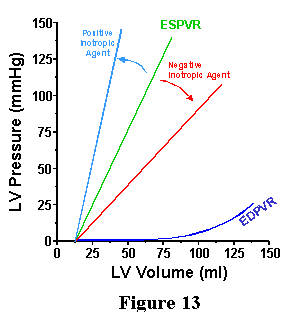 |
The major draw back to the use of Ees in the clinical setting is that it is very difficult to measure ventricular volume. Clearly, it is required that volume be measured in the assessment of Ees. Currently, the most commonly employed index of contractility in the clinical arena is ejection fraction (EF). EF is defined as the ratio between EDV and SV:
EF = SV/EDV * 100. [4]
This number ranges from 0% to 100% and represents the percentage of the volume present at the start of the contraction that is ejected during the contraction. The normal value of EF ranges between 55% and 65%. EF can be estimated by a number of techniques, including echocardiography and nuclear imagining techniques. The main disadvantage of this index is that it is a function of the properties of the arterial system. This can be appreciated by examination of the PV loops in the panel on the left of Figure 10, were ventricular contractility is constant yet EF is changing as a result of modified arterial properties. Nevertheless, because of its ease of measurement, and the fact that it does vary with contractility, EF remains and will most likely continue to be the preferred index of contractility in clinical practice for the foreseeable future.
IX. PRELOAD
Preload is the hemodynamic load or stretch on the myocardial wall at
the end of diastole just before contraction begins. The term was originally
coined in studies of isolated strips of cardiac muscle where a weight
was hung from the muscle to prestretch it to the specified load before
(pre-) contraction. For the ventricle, there are several possible measures
of preload: 1) EDP, 2) EDV, 3) wall stress at end-diastole and 4) end-diastolic
sarcomere length. Sarcomere length probably provides the most meaningful
measure of muscle preload, but this is not possible to measure in the
intact heart. In the clinical setting, EDP probably provides the most
meaningful measure of preload in the ventricle. EDP can be assessed
clinically by measuring the pulmonary capillary wedge pressure (PCWP)
using a Swan-Ganz catheter that is placed through the right ventricle
into the pulmonary artery.
X. AFTERLOAD
Afterload is the hydraulic load imposed on the ventricle during ejection.
This load is usually imposed on the heart by the arterial system, but
under pathologic conditions when either the mitral valve is incompetent
(i.e., leaky) or the aortic valve is stenotic (i.e., constricted) afterload
is determined by factors other than the properties of the arterial system
(we won't go into this further in this entry). There are several measures
of afterload that are used in different settings (clinical versus basic
science settings). We will briefly mention four different measures of
afterload.
1) Aortic Pressure. This provides a measure of the pressure that the ventricle must overcome to eject blood. It is simple to measure, but has several shortcomings. First, aortic pressure is not a constant during ejection. Thus, many people use the mean value when considering this as the measure of afterload. Second, as will become clear below, aortic pressure is determined by properties of both the arterial system and of the ventricle. Thus, mean aortic pressure is not a measure, which uniquely indexes arterial system properties.
2) Total Peripheral Resistance. The total peripheral resistance (TPR) is the ratio between the mean pressure drop across the arterial system [which is equal to the mean aortic pressure (MAP) minus the central venous pressure (CVP)] and mean flow into the arterial system [which is equal to the cardiac output (CO)]. Unlike aortic pressure by itself, this measure is independent of the functioning of the ventricle. Therefore, it is an index which describes arterial properties. According to its mathematical definition, it can only be used to relate mean flows and pressures through the arterial system.
3) Arterial Impedance. This is an analysis of the relationship between pulsatile flow and pressure waves in the arterial system. It is based on the theories of Fourier analysis in which flow and pressure waves are decomposed into their harmonic components and the ratio between the magnitudes of pressure and flow waves are determined on a harmonic-by-harmonic basis. Thus, in simplistic terms, impedance provides a measure of resistance at different driving frequencies. Unlike TPR, impedance allows one to relate instantaneous pressure and flow. It is more difficult to understand, most difficult to measure, but the most comprehensive description of the intrinsic properties of the arterial system as they pertain to understanding the influence of afterload on ventricular performance.
4) Myocardial Peak Wall Stress. During systole, the muscle contracts
and generates force, which is transduced into intraventricular pressure,
the amount of pressure being dependent upon the amount of muscle and
the geometry of the chamber. By definition, wall stress (![]() )
is the force per unit cross sectional area of muscle and is simplistically
interrelated to intraventricular pressure (LVP) using Laplace's law:
)
is the force per unit cross sectional area of muscle and is simplistically
interrelated to intraventricular pressure (LVP) using Laplace's law:
![]() =LVP*r/h, where
r is the internal radius of curvature of the chamber and h is the wall
thickness. In terms of the muscle performance, the peak wall stress
relates to the amount of force and work the muscle does during a contraction.
Therefore, peak wall stress is sometimes used as an index of afterload.
While this is a valid approach when trying to explain forces experienced
by muscles within the wall of the ventricular chamber, wall stress is
mathematically linked to aortic pressure which, as discussed above,
does not provide a measure of the arterial properties and therefore
is not useful within the context of indexing the afterload of the ventricular
chamber.
=LVP*r/h, where
r is the internal radius of curvature of the chamber and h is the wall
thickness. In terms of the muscle performance, the peak wall stress
relates to the amount of force and work the muscle does during a contraction.
Therefore, peak wall stress is sometimes used as an index of afterload.
While this is a valid approach when trying to explain forces experienced
by muscles within the wall of the ventricular chamber, wall stress is
mathematically linked to aortic pressure which, as discussed above,
does not provide a measure of the arterial properties and therefore
is not useful within the context of indexing the afterload of the ventricular
chamber.
XI. UNDERSTANDING THE DETERMINANTS OF VENTRICULAR
PERFORMANCE
Two primary measures of overall cardiovascular performance are the arterial
blood pressure and the cardiac output. These parameters are also of
primary concern in the clinical setting since both an adequate blood
pressure and an adequate cardiac output are necessary to maintain life.
It is important to appreciate, however, that both cardiac output and
blood pressure are determined by the interaction between the heart,
the arterial system (afterload) and the venous system (preload); this
is a fundamental concept. Furthermore, it is important to develop an
appreciation for how the heart and vasculature interact to determine
these indices of performance. This is highlighted by the fact that one
major facet of intensive care medicine deals with maintaining adequate
blood pressure and cardiac output by manipulating ventricular contractility,
heart rate, arterial resistance and ventricular preload. Two approaches
to understanding how these parameters regulate cardiovascular performance
will be reviewed: a classical approach, commonly referred to as Frank-Starling
Curves, and a more modern approach based upon pressure-volume analyses.
Frank-Starling Curves
Otto Frank (1899) is credited with the seminal observation that peak
ventricular pressure increases as the end-diastolic volume is increased
(as in Fig. 8). This observation was made in an isolated frog heart
preparation in which ventricular volume could be measured with relative
ease. Though of primary importance, the significance may not have been
appreciated to the degree it could have been because it was (and remains)
difficult to measure ventricular volume in more intact settings (e.g.,
experimental animals or patients). Thus it was difficult for other investigators
to study the relationship between pressure and volume in these more
relevant settings.
Around the mid 1910's, Starling and coworkers observed a related phenomenon, which they presented in a manner that was much more useful to physiologists and ultimately to clinicians. They measured the relationship between ventricular filling pressure (related to end-diastolic volume) and cardiac output (CO=SVxHR). They showed that there was a nonlinear relationship between end-diastolic pressure (EDP, also referred to as ventricular filling pressure) and CO as shown in Fig. 14; as filling pressure was increased in the low range there is a marked increase in CO, whereas the slope of this relationship becomes less steep at higher filling pressures.
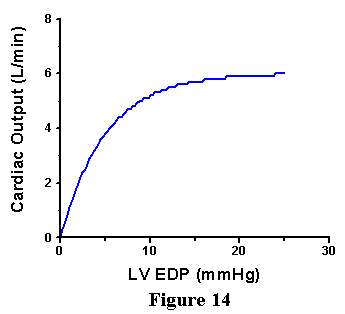
The observations of Frank and of Starling form one of the basic concepts of cardiovascular physiology that is referred to as the Frank-Starling Law of the Heart: cardiac performance (its ability to generate pressure or to pump blood) increases as preload is increased. There are a few caveats, however. Recall from the anatomy of the cardiovascular system that left ventricular filling pressure is approximately equal to pulmonary venous pressure. As pulmonary venous pressure rises there is an increased tendency (Starling Forces) for fluid to leak out of the capillaries and into the interstitial space and alveoli. When this happens, there is impairment of gas exchange across the alveoli and hemoglobin oxygen saturation can be markedly diminished. This phenomenon typically comes into play when pulmonary venous pressure rises above -20mmHg and becomes increasingly prominent with further increases. When pulmonary venous pressures increases above 25-30 mmHg, there can be profound transudation of fluid into the alveoli and pulmonary edema is usually prominent. Therefore, factors extrinsic to the heart dictate a practical limit to how high filling pressure can be increased.
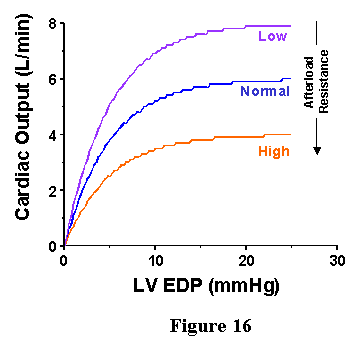
As noted above, factors other than preload are important for determining cardiac performance: ventricular contractility and afterload properties. Both of these factors can influence the Frank-Starling Curves. When ventricular contractile state is increased, CO for a given EDP will increase and when contractile state is depressed, CO will decrease (Fig. 15). When arterial resistance is increased, CO will decrease for a given EDP while CO will increase when arterial resistance is decreased (Fig. 16). Thus, shifts of the Frank-Starling curve are nonspecific in that they may signify either a change in contractility or a change in afterload. It is for this reason that Starling-Curves are not used as a means of indexing ventricular contractile strength.
 |
 |
Ventricular-Vascular Coupling
Analyzed on the Pressure-Volume Diagram
We have already discussed in detail how ventricular properties are represented
on the PV diagram and how they are modified by inotropic agents. We
have seen examples of PV loops obtained with constant ventricular properties
at different EDVs and arterial properties (Figure 10). Therefore, let
us now turn to a discussion of how arterial properties can be represented
on the PV diagram. Specifically, we will explore how TPR can be represented
on the PV diagram an index of afterload, called Ea, which stands for
effective arterial elastance that is closely related to TPR. The ultimate
goal of the discussion to follow is to provide a quantitative method
of uniting ventricular afterload, heart rate, preload and contractility
on the PV diagram so that cardiovascular variables such as cardiac output
(stroke volume) and arterial pressure can be determined from ventricular
and vascular properties.
Let us start with the definition of TPR:
TPR = [MAP - CVP] / CO ----- [4]
where CVP is the central venous pressure and MAP is the mean arterial pressure. Cardiac output (CO) represents the mean flow during the cardiac cycle and can be expressed as:
CO = SV * HR ----- [5]
where SV is the stroke volume and HR is heart rate. Substituting Eq. [5] into Eq. [4] we obtain:
TPR = [MAP - CVP] / (SV*HR) . ----- [6]
At this point we make two simplifying assumptions. First, we assume that CVP is negligible compared to MAP. This is reasonable under normal conditions, since the CVP is generally around 0-5 mmHg. Second, we will make the assumption that MAP is approximately equal to the end-systolic pressure in the ventricle (Pes). Making these assumptions, we can rewrite Eq. [6] as:
TPR = Pes / (SV*HR) ----- [7]
which can be rearranged to:
TPR * HR = Pes / SV .----- [8]
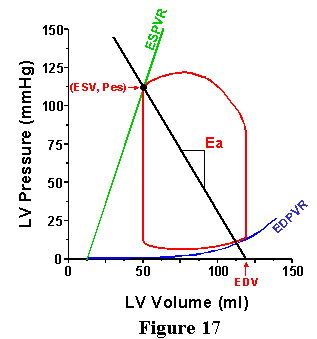
Note, as shown in Fig. 17, that the quantity Pes/SV can be easily ascertained from the pressure volume loop by taking the negative value of the slope of the line connecting the point on the volume-axis equal to the EDV with the end-systolic pressure-volume point. Let us define the slope of this line as Ea:
Ea = Pes/SV . ----- [9]
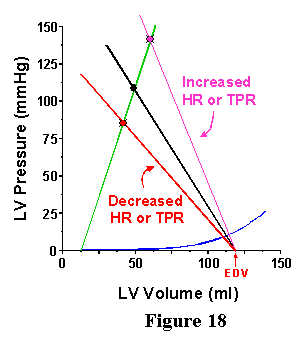
This term is designated E for "elastance" because the units of this index are mmHg/ml (the same as for Ees). The "a" denotes that this term is for the arterial system. Note that this measure is dependent on the TPR and heart rate. If the TPR or HR goes up, then Ea goes up, as illustrated in Fig. 18; reduction in either TPR or HR cause a reduction in Ea. As shown in this Figures 17 and 18, the Ea line is drawn on the pressure-volume diagram (the same set of axes as the ESPVR and the EDPVR); it starts at EDV and has a slope of -Ea and intersects with the ESPVR at one point.
Next, we will use these features of the pressure-volume diagram to demonstrate that it is possible to estimate how the ventricle and arterial system interact to determine such things as mean arterial pressure (MAP) and SV when contractility, TPR, EDV or HR are changed. In order to do this, we reiterate the parameters, which characterize the state of the cardiovascular system. First, are those parameters necessary to quantify the systolic pump function of the ventricle; these are Ees and Vo, the parameters which specify the ESPVR. Second, are the parameters which specify the properties of the arterial system; we will take Ea as our measure of this, which is dependent on TPR and heart rate. Finally we must specify a preload; this can be done by simply specifying EDV or, if the EDPVR is known, we can specify EDP. If we specify each of these parameters, then we can estimate a value for MAP and SV (and CO, since CO=SV.HR) as depicted in Fig. 19.
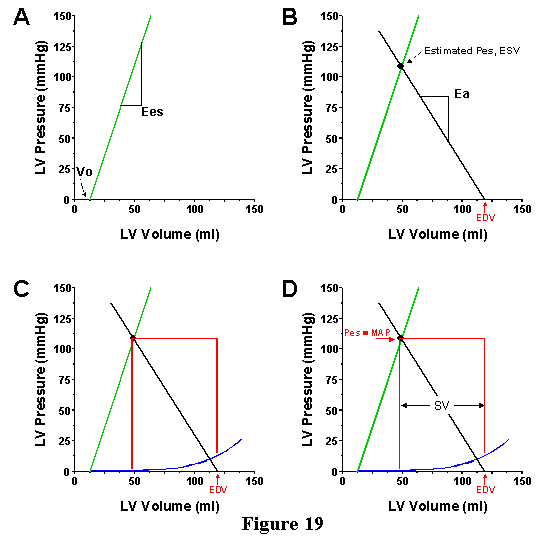
In order to do this, first draw the ESPVR line (panel A). Second (panel B), mark the EDV on the volume axis and draw a line through this EDV point with a slope of -Ea. The ESPVR and the Ea line will intersect at one point. This point is the estimate of the end-systolic pressure-volume point. With that knowledge you can draw a box which represents an approximation of the PV loop under the specified conditions, with the bottom of the box determined by the EDPVR (Panel C). SV and Pes can be measured directly from the diagram. Recall that Pes is roughly equal to MAP.
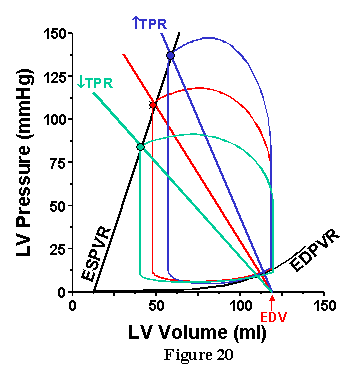
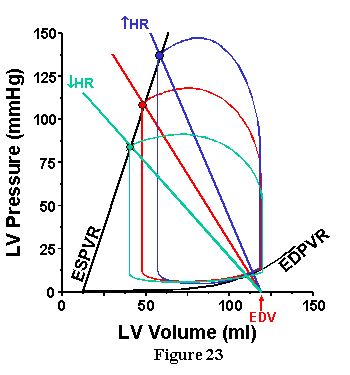
Use of this technique is illustrated in Figure. 20 through 23. In each case, the ESPVR and Ea for the specified conditions are drawn on the pressure-volume diagram superimposed on actual PV loops. In Fig. 20 we see what happens if TPR is altered, but EDV is kept constant. As TPR is increased, the slope of the Ea line increases and intersects the ESPVR at an increasingly higher pressure and higher volume. Thus, increasing TPR increases MAP but decreases SV (and CO) when ventricular properties (Ees, Vo and HR) are constant.
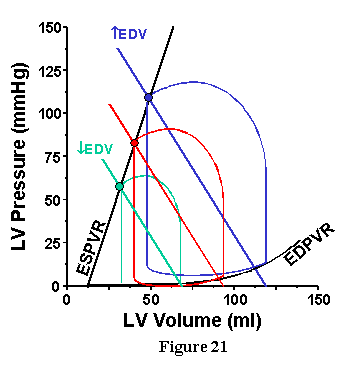
The influence of preload (EDV) is shown in the three loops of Fig. 21. Here, the ESPVR, HR and TPR are constant so that Ea is also constant. The slope of the Ea line is not altered when preload is increased, the Ea line is simply shifted in a parallel fashion. With each increase in preload volume, Pes and SV increase, and clearly it is possible to make a quantitative prediction of precisely how much.
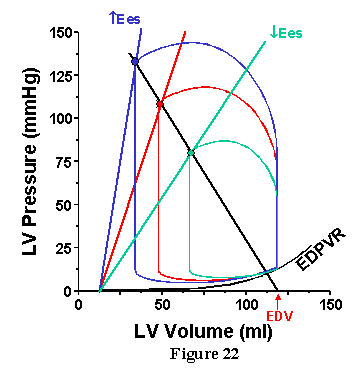
The influence of contractility is shown in Fig. 22. In this case, nothing is changed in the arterial system and the EDV is constant; Ees is the only thing to change. When Ees is increased, the Ea line intersects the ESPVR at a higher pressure and lower volume. Therefore, despite increased MAP, SV increases (which contrasts with the decreased SV obtained with increased MAP when TPR is increased).
Finally, the influence of HR is shown in Fig. 23. The effect of increasing HR is similar to the effect of increasing TPR as predicted by the fact that both influence Ea in the same way.
For those of you that are quantitatively inclined, you can derive the following equations which mathematically predict Pes (.MAP) and SV based on the graphical techniques described above:
Pes = [EDV - Vo] / [1/Ea + 1/Ees]
SV = [EDV - Vo] / [1 + Ea/Ees]
The technique described above is useful in predicting Pes and SV when the parameters of the system are known. It is also useful in making qualitative predictions (e.g., does SV increase or decrease) when only rough estimates of the parameters are available. Thus, this system provides a simple means of understanding the determinants of cardiac output and arterial pressure.
 |
 |
 |
 |