Visuals Aloft: Interactive Graphing with Highcharts
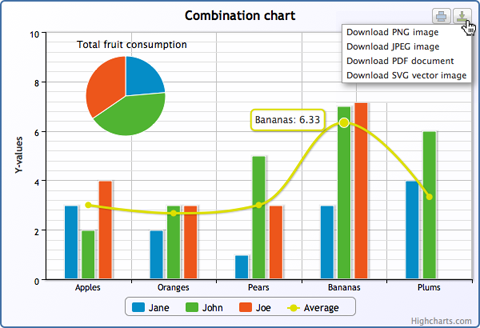
Highcharts is a web-based solution for high quality, interactive graphing and charting data. This open source library is written in JavaScript and it supports a gamut of chart types that includes line, spline, area, areaspline, column, bar, pie and scatter charts. It is compatible with modern browsers as well as the iPhone and iPad.
Additional attractive features in Highcharts are:
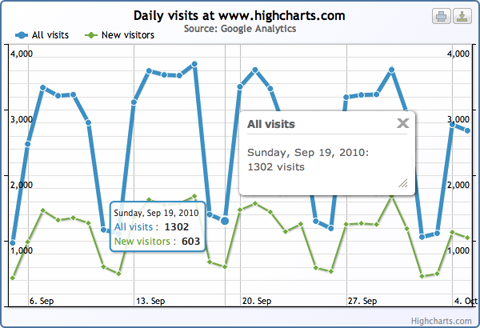
- tooltip labels to display information for each points and series
- zooming on a specific part of a chart for a detailed analysis
- loading of data source store in a separate file or from a different host site altogether
- export to image file or PDF.


Neither Flash, Java, or other plugins are required to display these graphical animations. Highcharts relies on built-in browser technologies and uses a single JavaScript file and a framework such as jQuery, MooTools or Prototype.
The set-up instructions for Highcharts are well-documented and the scripting requires no special programming skills. Highcharts website also has a demo page that list the different types of charts and graphs it can produce.
Highcharts is free for educational and non-profit use. A range of fees apply for it use on commercial sites.


