The Boss Checks In
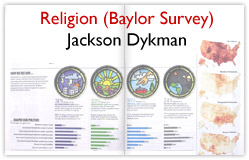
With the religion spread done as well as the population density map, Dykman had two spreads tacked to his wall by Tuesday, October 17. This, coincidentally, was the day that the Census estimated marked the arrival of the 300 millionth American—either by birth, by airplane or on foot. October 17 also marked the first time Managing Editor Stengel visited Dykman’s office to observe his progress.
There was little Dykman could show him other than several blank pages, a map, and the religion spread he had completed. Yet Stengel perused the wall, as Dykman recalls, with interest.
He said something like, "Wow, that’s pretty interesting… but you’ve put me in a tough spot." I said, "Oh?" He [said], "Well, I really wanted to hate it, but I don’t."
Dykman muses that there was some truth behind Stengel’s joking compliment. The piece was already behind the news peg, and Stengel could easily have killed it if he was unimpressed with Dykman’s progress. “At which point,” Dykman says, “I would have just gone home and gone to sleep, because I was really tired.”
But Stengel urged Dykman to continue working on the project. Dykman realized this did not mean the project would definitely see print. It only meant that Dykman would continue to work on it for several more days, at which point, he feared, Stengel might still decide not to publish the piece after all. “But,” Dykman shrugs, “that’s the business.”
Time Use . Meanwhile, the spread on the American Time Use Survey was creating unexpected problems. What Dykman had envisioned as an easy job for his young colleague Masters was a much bigger project. The data as presented in the Time Use Survey did not lend itself to Dykman’s planned presentation as a 24-hour clock. Survey respondents reported performing the same activities at different times of day, as well as performing multiple activities at once. Thus, average times reported spent on various activities during the day added up to well over 24 hours. The clock presentation would have to be scrapped. [35]

|

|

|

|

|

|
Masters spoke to numerous academics to help her untangle the data. She even found a professor in the Netherlands who had constructed an online time use clock using Macromedia Flash Player. The problem, in Dykman’s estimation, was that it was “utterly incomprehensible,” not to mention untranslatable to a paper format.
“If we had done this over the course of five or six weeks, [we] probably would have killed [the time use spread] and maybe put education instead,” Dykman recalls. “I had five or six other themes that would have worked.” But by this point, the entire project was due in a matter of days. Dykman decided to try to present the data they had rather than start a new spread from scratch. The challenge now was to take the unwieldy data Masters had uncovered and forge a compelling visual presentation.
Masters had also found some intriguing trivia she wanted to include. For example, the more educated a Time Use Survey respondent was on average, the less time he spent per week working. She also learned that different categories of people tended to perform the same activities at different times of day, depending on factors like age and marital status. But it was not obvious how these facts could be incorporated into the time use spread, nor what should be left out.
Consumption . The consumption page had also hit a roadblock. Dykman had predicated his plan for this page on access to the detailed information Wal-Mart kept about all purchases made there. But Wal-Mart would not disclose the information. Reporter Dell had several conversations with a contact at Wal-Mart, but the megastore ultimately declined to participate.
“So what do you do then? Well, you just start calling companies. And Kristina [Dell] just kept calling, calling,” says Dykman. Finally, Dell found a willing participant in the Unilever Corporation, which made food and personal-care products. Relying only on Unilever’s data, though, would yield a page focused almost exclusively on food, and Dykman wanted variety. He recalls thinking: “We have a lot of food. We need some cars. We need some gadgets. We need pets. How about some booze?” He and Dell “just kept calling” companies to find out what they sold and how much.
Dykman let Dell select the products displayed, but suggested juxtapositions: If they showed how many Camrys were sold, they would have to do the same for an expensive car, like a Porsche. The number of high calorie Krispy Kreme original glazed donuts consumed on an average day in America should be paired with the same statistic for cans of Slim-Fast diet shakes.
Footnotes
[35] Author’s interview with Coco Masters, on April 19, 2007, in New York City.