Exploring YouTube Usage Information
This past May, video recordings of Columbia University's 2010 commencement ceremonies were published to YouTube. A number of Columbia videos quickly rocketed to the top of YouTube EDU's most viewed list, creating an excellent opportunity to examine how the YouTube platform is used by a worldwide audience and to perform some meaningful interpretation of the usage data using Insight, YouTube's built-in analytic tool. This entry will explore some useful features of Insight, which provides detailed metrics on YouTube viewership.

Fig. 1: YouTube EDU's most-viewed list for May 23, 2010
Video Content
Twenty-four videos of Columbia commencement events were made available on YouTube EDU. Sixteen of these videos were full-length recordings of school graduation ceremonies, while eight videos were excerpts of guest speakers.
What is Insight?
Insight is an analytic tool available to YouTube accounts that provides comprehensive statistical data for each video upload. Insight is available to YouTube channel administrators and can be accessed from the account management area. Usage data is organized into distinct reporting modules covering overall viewing data, how videos were discovered, and how well videos retained viewer's attention. Below, we will analyze a number of these reporting modules including: Summary Dashboard, Views, Discovery, and Hot Spots.
Summary Dashboard Module
When first navigating to the Insight section, a dashboard displays a series of charts and graphs that summarize overall channel usage data. Here, the YouTube channel administrator can quickly review overall video views, demographics data, and video popularity by international location.

Fig. 2: YouTube Insight - Summary Dashboard
While not pictured above, the Summary module also features a graph that can be adjusted by date, so that viewing data can be approximated to either overall viewing data for the entire history of a YouTube channel or for particular dates.
For the purposes of this entry, we will examine video usage data for the week of Columbia commencement activities, which took place between May 17th and May 23rd, 2010. Some additional overall usage data from the time of this writing is also presented for comparison.
Views Module
Views are the total number of times a video has been accessed, much like a web pageview. Video viewing data are grouped in two ways: collectively for all videos within the channel or by individual video view counts.
The examination of the data can reveal how quickly videos are discovered on YouTube. When looking at the views data for Columbia commencement videos, it is clear that they found an audience very quickly. The commencement videos were posted 10-12 hours after each event concluded, yet within hours, the content was being accessed heavily on YouTube.
Listed below are the total number of views for the top five full event videos during the week of commencement. Since that time, viewing of these videos has continued, far exceeding the initial viewing numbers:
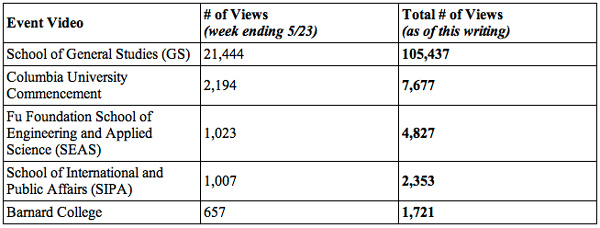
A number of guest speaker excerpts were more widely watched that the full event videos. Here is a table of viewing statistics of event speaker videos, ranked in order of most viewed:
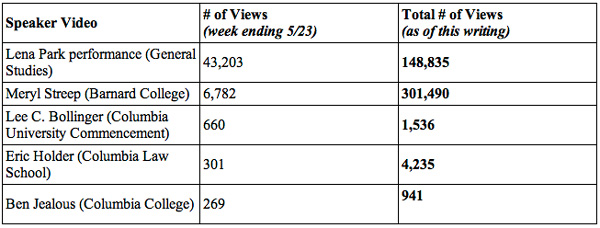
Viewing information on individual videos are displayed in a similar fashion to overall channel video views, as can be seen in the image below that details the viewing data of one video that turned out to be the most watched during the week of commencement: the School of General Studies class day ceremonies featured Korean pop artist Lena Park, a 2010 graduate, singing the U.S. National Anthem.

Fig. 5: YouTube Insight - Lena Park performance, Views Panel
Additionally, the Views module allows the administrator to assess viewing information based on location. The ability to see views by location identifies what types of videos are most popular to an audience in a particular country. For example, given her international popularity, the video of Lena Park's performance was by far the most watched Columbia video worldwide-it became the third most overall viewed Education video on YouTube and the third most viewed YouTube video in South Korea, while also landing in the top ten of all views in Japan, Australia, and Canada. In North America, however, the most watched speaker video was actress Meryl Streep's address to Barnard graduates.
Discovery Module
The "Discovery" module reports how viewers are finding videos using categories such as search, links, and embedded players. This panel also provides data on which related YouTube videos are driving views to a particular video. The image below is of the "Discovery"panel for the Lena Park performance video.

Fig. 6: YouTube Insight - Lena Park performance, Discovery Panel
The key categories that provide the most worthwhile data are:
- No link referrer - video views originating from an embedded player within an external site; commonly Facebook and blog referrals
- External links - video views that originated from links attached to external websites or platforms; Twitter brings in a high volume of external links
- Google Search - video found via Google search
- YouTube Search - video found via YouTube search
- YouTube Other - video found via YouTube portals & widgets
- Related Videos - data on which related YouTube videos are driving views to a particular video
More than half of the Columbia commencement videos were found and viewed from videos embedded on an external site (ie. a no link referrer), or from video URLs linked on external websites (ie. a link referrer). For example, Columbia school websites linked to video URLs or embedded commencement videos within their own websites, strengthening the availability of these videos to both current and graduating students (as well as their families). These schools included Columbia College, Barnard College, School of General Studies, School of International and Public Affairs, Graduate School of Journalism, as well as the Columbia Alumni Association. Facebook also drove traffic to Columbia videos using video URLs and embedded video links.
Video links traded through Twitter, e-mail, and instant messaging represent examples of an "External link" referrer. "External Links" are when external websites have linked to a URL of a unique video. Many news websites and blogs have linked to Columbia University commencement videos, including: Google, Huffington Post, The New York Times, ABC News, Salon, Yahoo!, AOL (Facebook and Twitter can also be included in this grouping).
Perhaps the most insightful category in the Discovery module is the "Related Videos" section, which reports which videos are driving views to other videos, not only within the same channel, but elsewhere on YouTube. Users who viewed one Columbia commencement video also viewed at least two to three other Columbia related videos in YouTube EDU on average. This can be seen in the following graphic, which details the videos that referred viewers to the Lena Park performance video.

YouTube Insight - Lena Park performance, related videos from Discovery Panel
A final note on the Discovery module: while we were pleasantly surprised how quickly videos found a strong audience, we missed a big opportunity to drive more traffic to the videos when we were unable to get the Columbia Commencement 2010 website nor the Columbia University home page to feature links to the YouTube archive. It is hard to estimate how many additional viewers would have discovered the commencement videos had those references been available.
Hot Spots Module
The last feature to explore is the "Hot Spots" module, which creates a visualization of audience attention, the overall measure of your video's ability to retain its audience. This approximates where viewers both tune in and tune out of a particular video.
As can be seen from the Lena Park video, attention is strong at the beginning of the clip, and with another peak at three-quarters of the way through. During the last portion of the video, where Ms. Park's performance ends, the video ability to hold attention declines dramatically.

Fig. 8: Lena Park Hot Spot Graph
Compare this to the video of Meryl Streep's address to Barnard graduates. Here, audience attention is strong for the entire duration of the video, with the only significant drop off occurring at the conclusion of her speech.

Fig. 9: Meryl Streep Hot Spot Graph
The "Hot Spots" data provides content creators with information on which portions of a video are being watched the most by viewers
Summary
YouTube Insight provides valuable usage information showing content creators a wide rage of data for analysis. The data is presented clearly and graphically so that it can be easily understood. Insight reports can help track the worldwide reach of YouTube videos, how they are being discovered and how well they retain their audience.